Sensor overloading is a common cause of ski slope data and is simple to detect using
the methods described below.
A common problem in industrial vibration monitoring applications is sensor overload. For a given sensor
sensitivity and powering, there is a limit to the total amount of vibration that can be measured (usually 50
to 80 g for a 100 mV/g sensor). When the total vibration limit is exceeded, erroneous data will be produced.
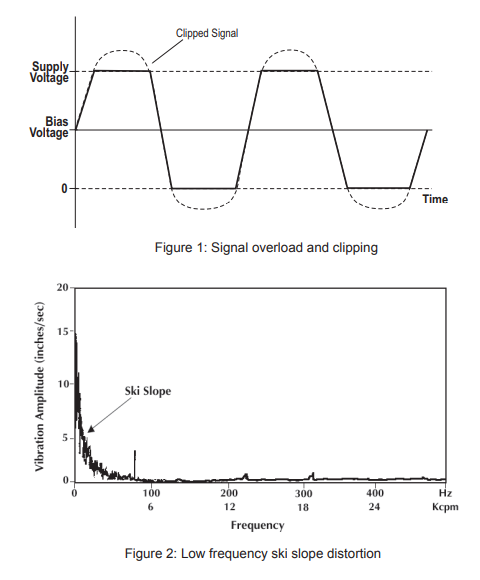
As shown in Figure 1, the time wave data will exhibit a clipped signal. The frequency data will show excessive
low frequency vibration – commonly known as the “ski slope” effect (see Figure 2). This erroneous data will
confuse data analysis and possibly lead to incorrect fault diagnosis.
To test for sensor overload, a lower sensitivity sensor can be substituted. Use of a 10 mV/g sensor in place of
a 100 mV/g unit will provide 10 times the vibration range:
500 g’s, versus 50 g’s. The additional range will allow the
user to accurately measure the total vibration present and
select the most suitable sensitivity for the application.
Another test method is to use a “mechanical filter,” such as a piece of rubber or even a business card which can
be temporarily placed between the sensor and machine. This type of mechanism will filter out much of the high
frequency vibration which may be overloading the sensor. If the clipping and ski slope are no longer present, the
original sensor was most likely overloaded.
Using an accelerometer with a lower sensitivity will provide enough range for the application. Be aware, however,
that a lower sensitivity accelerometer will give less output for a given vibration level (and lower signal to noise ratio),
which may hinder acquisition of low amplitude data. Also note that sensor overload is only one of many possible
causes of ski slope data.